Table of Contents
ToggleUnderstanding the Inverse Head and Shoulders Pattern: A Powerful Trading Strategy

In the world of technical analysis, patterns play a crucial role in predicting market movements. Among these, the inverse head and shoulders pattern stands out as a particularly reliable indicator of a bullish reversal. Recognizing this pattern can empower traders to make informed decisions and potentially capitalize on market trends. This article delves deep into the intricacies of the inverse head and shoulders pattern, exploring its structure, significance, and practical applications in trading.
What is the Inverse Head and Shoulders Pattern?
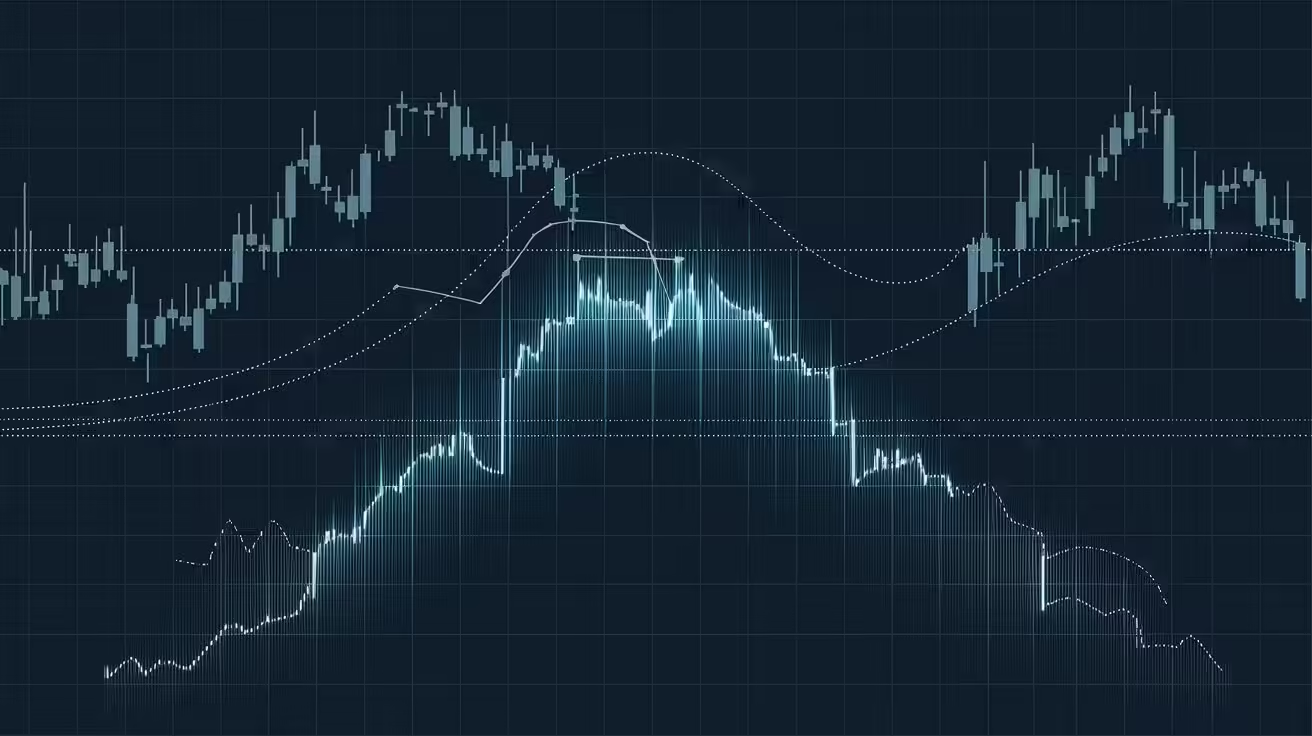
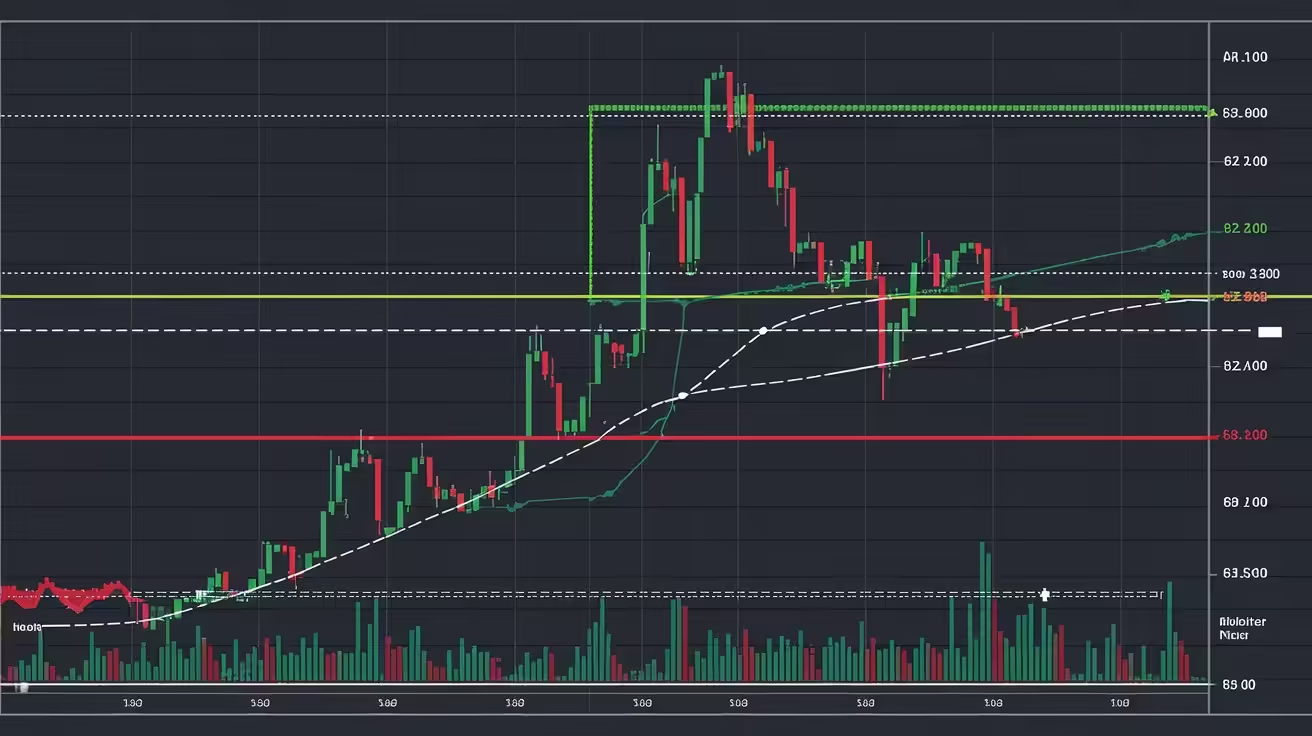
The inverse head and shoulders pattern is a chart formation that signals a potential reversal in a downtrend, indicating that the market may be transitioning to an uptrend. It is essentially the opposite of the traditional head and shoulders pattern, which suggests a bearish reversal. This pattern is composed of three distinct troughs: a lower trough (the “head”) flanked by two higher troughs (the “shoulders”). The pattern is completed by a “neckline,” which connects the peaks of the two shoulders and serves as a key level of resistance.
When the price breaks above the neckline after forming the second shoulder, it confirms the pattern and suggests that a bullish trend is likely to follow. Traders often view this breakout as a strong signal to enter long positions, anticipating that the price will continue to rise.
Components of the Inverse Head and Shoulders Pattern
To fully grasp the significance of the inverse head and shoulders pattern, it is essential to understand its components:
- Left Shoulder: This is the first trough in the pattern, representing an initial decline in price followed by a modest recovery.
- Head: The head is the lowest point in the pattern, forming the central trough. It represents a deeper decline, often seen as the climax of the downtrend.
- Right Shoulder: The right shoulder is the third trough, similar in height to the left shoulder, and signifies the market’s final attempt to push lower before reversing.
- Neckline: The neckline is a resistance level drawn by connecting the peaks between the left shoulder and the head, and the head and the right shoulder. The breakout above this line confirms the pattern.
- Volume: While not a structural component, volume plays a critical role in validating the pattern. A significant increase in volume during the breakout above the neckline reinforces the bullish signal.
How to Identify the Inverse Head and Shoulders Pattern
Identifying the inverse head and shoulders pattern requires careful observation of price movements on a chart. Here are the steps to follow:
- Observe the Downtrend: The pattern typically forms after a prolonged downtrend, where the market has been consistently making lower lows and lower highs.
- Spot the Left Shoulder: Look for the first trough, which should be followed by a recovery that fails to reach the previous high.
- Identify the Head: The second trough should be the lowest point in the pattern, signaling a deeper decline than the left shoulder.
- Look for the Right Shoulder: The third trough should be similar in depth to the left shoulder, indicating that the market is struggling to push lower.
- Draw the Neckline: Connect the peaks between the left shoulder and the head, and the head and the right shoulder, to form the neckline.
- Wait for the Breakout: The pattern is confirmed when the price breaks above the neckline, ideally on increased volume.

Trading the Inverse Head and Shoulders Pattern
Once the inverse head and shoulders pattern has been identified, traders can use it to develop a trading strategy. Here’s how to approach trading this pattern:
1. Entering the Trade:
The most common entry point is when the price breaks above the neckline. Traders often set a buy order slightly above the neckline to ensure that the breakout is genuine. Waiting for a retest of the neckline after the breakout can also provide a safer entry point, as it confirms that the previous resistance level has turned into support.
2. Setting Stop-Loss Orders:
To manage risk, it is crucial to set a stop-loss order. This is typically placed just below the right shoulder or the head, depending on the trader’s risk tolerance. The stop-loss protects against false breakouts or unexpected market reversals.
3. Determining the Profit Target:
The profit target can be estimated by measuring the distance from the neckline to the head and then projecting this distance upwards from the point of breakout. This gives traders a realistic expectation of how far the price might move in their favor.
4. Monitoring Volume:
Volume is a critical factor in trading the inverse head and shoulders pattern. A significant increase in volume during the breakout confirms the pattern’s validity and indicates strong buying interest. Conversely, if the breakout occurs on low volume, traders should be cautious, as this could signal a weak move that might not sustain.
The Psychology Behind the Inverse Head and Shoulders Pattern
Understanding the psychology behind the inverse head and shoulders pattern can provide valuable insights into why this pattern is so effective. The pattern reflects a shift in market sentiment from bearish to bullish. Initially, the market is in a downtrend, with sellers in control. The left shoulder represents a temporary recovery as buyers step in, but they lack the strength to reverse the trend. The head forms as the market makes a new low, but the lack of follow-through suggests that selling pressure is waning.
As the market attempts to push lower again (forming the right shoulder), buyers become more aggressive, preventing a new low. This balance between buyers and sellers creates the right shoulder. When the price finally breaks above the neckline, it signals that buyers have gained the upper hand, and the trend is likely to reverse.
Common Mistakes When Trading the Inverse Head and Shoulders Pattern
Despite its reliability, the inverse head and shoulders pattern can still lead to losses if not traded correctly. Here are some common mistakes to avoid:
1. Premature Entry:
Entering the trade before the price breaks above the neckline is a common mistake. Without a confirmed breakout, the pattern is incomplete, and the downtrend may continue.
2. Ignoring Volume:
Volume is a critical factor in confirming the breakout. A breakout on low volume may indicate a false move, leading to a potential reversal and losses.
3. Overlooking Stop-Loss Orders:
Failing to set a stop-loss order can result in significant losses if the market moves against the trade. It is essential to protect your capital by placing a stop-loss below the right shoulder or the head.
4. Misinterpreting the Pattern:
Not every chart formation that resembles an inverse head and shoulders pattern will result in a bullish reversal. Traders should ensure that all components of the pattern are present before making a trade.
Variations of the Inverse Head and Shoulders Pattern
While the classic inverse head and shoulders pattern is the most widely recognized, there are variations that traders should be aware of:
1. Complex Inverse Head and Shoulders Pattern:
In some cases, the pattern may feature multiple shoulders on either side of the head. This can make the pattern more challenging to identify, but it can also indicate a stronger reversal when confirmed.
2. Inverse Head and Shoulders on Different Timeframes:
The pattern can appear on various timeframes, from minutes to months. While the principles remain the same, the implications of the pattern will vary depending on the timeframe. Shorter timeframes may signal shorter-term reversals, while longer timeframes suggest more significant trend changes.
3. Inverse Head and Shoulders with a Sloping Neckline:
In some instances, the neckline may slope upward or downward. An upward-sloping neckline is considered more bullish, as it indicates that the price has been making higher lows. Conversely, a downward-sloping neckline may signal a weaker reversal.
Real-Life Examples of the Inverse Head and Shoulders Pattern
Examining historical examples of the inverse head and shoulders pattern can provide practical insights into how this pattern plays out in the real world. Here are a few notable instances:
1. The S&P 500 in 2009:
Following the financial crisis of 2008, the S&P 500 formed a textbook inverse head and shoulders pattern between November 2008 and March 2009. The pattern signaled the end of the bear market and the beginning of a new bull market that lasted for several years.
2. Gold Prices in 2020:
In 2020, gold prices formed an inverse head and shoulders pattern on the daily chart, signaling a bullish reversal that led to a significant rally. The breakout above the neckline was accompanied by a sharp increase in volume, confirming the pattern’s validity.
3. Bitcoin in 2021:
Bitcoin’s price action in mid-2021 also exhibited an inverse head and shoulders pattern, which preceded a strong bullish move. The pattern was widely recognized by traders and analysts, leading to increased buying pressure and a sustained uptrend.

The Inverse Head and Shoulders Pattern in Modern Trading
In today’s fast-paced trading environment, the inverse head and shoulders pattern remains a popular tool for both novice and experienced traders. With the advent of advanced charting software and online trading platforms, identifying and trading this pattern has become more accessible than ever. However, success still depends on a solid understanding of the pattern and disciplined risk management.
Integrating the Inverse Head and Shoulders Pattern into a Trading Strategy
To maximize the effectiveness of the inverse head and shoulders pattern, it should be integrated into a broader trading strategy that considers other technical indicators, market conditions, and individual risk tolerance. Here are some tips for incorporating this pattern into your trading plan:
1. Combine with Other Indicators:
While the inverse head and shoulders pattern is a powerful signal on its own, combining it with other technical indicators such as moving averages, RSI (Relative Strength Index), or MACD (Moving Average Convergence Divergence) can provide additional confirmation and improve the accuracy of your trades.
2. Consider Market Context:
It’s important to consider the broader market context when trading the inverse head and shoulders pattern. For example, a bullish pattern in a strong uptrend may have a higher probability of success than in a choppy or uncertain market.
3. Practice Patience:
Trading the inverse head and shoulders pattern requires patience. Wait for the pattern to fully form and for the price to break above the neckline before entering the trade. Impulsive decisions can lead to premature entries and losses.
4. Backtesting and Practice:
Before trading the inverse head and shoulders pattern with real money, it’s advisable to backtest the pattern on historical data and practice in a simulated trading environment. This can help you build confidence and refine your strategy.
Frequently Asked Questions
What is the inverse head and shoulders pattern?
The inverse head and shoulders pattern is a bullish chart formation that signals a reversal of a downtrend. It consists of three troughs, with the middle one being the lowest (the head) and the two outer ones being higher (the shoulders).
How reliable is the inverse head and shoulders pattern?
The inverse head and shoulders pattern is considered one of the most reliable chart patterns in technical analysis. However, its success depends on correct identification, confirmation through a breakout above the neckline, and consideration of volume.
Can the inverse head and shoulders pattern fail?
Yes, like any technical pattern, the inverse head and shoulders pattern can fail. False breakouts and unexpected market conditions can lead to pattern failures. It’s important to use risk management tools like stop-loss orders.
What timeframe works best for the inverse head and shoulders pattern?
The inverse head and shoulders pattern can be used on various timeframes, from intraday charts to weekly charts. The best timeframe depends on your trading style and objectives. Longer timeframes generally indicate more significant trend changes.
How can I confirm the inverse head and shoulders pattern?
Confirmation of the inverse head and shoulders pattern occurs when the price breaks above the neckline, ideally on increased volume. Additional confirmation can come from other technical indicators or a retest of the neckline.
Can the inverse head and shoulders pattern be used in all markets?
Yes, the inverse head and shoulders pattern can be applied to various markets, including stocks, commodities, forex, and cryptocurrencies. However, the pattern’s effectiveness may vary depending on the market’s characteristics and volatility.
What is the inverse head and shoulders pattern?
The inverse head and shoulders pattern is a bullish chart formation in technical analysis that indicates a potential reversal in a downtrend. It consists of three distinct troughs, with the middle trough being the deepest (referred to as the “head”) and the two outer troughs being shallower (known as the “shoulders”). The pattern is completed by a “neckline” connecting the peaks between the shoulders. When the price breaks above the neckline after forming the right shoulder, it signals a possible shift from a bearish trend to a bullish trend.
How does the inverse head and shoulders pattern differ from the traditional head and shoulders pattern?
The inverse head and shoulders pattern is essentially the opposite of the traditional head and shoulders pattern. While the traditional head and shoulders pattern signals a bearish reversal and forms after an uptrend, the inverse head and shoulders pattern signals a bullish reversal and forms after a downtrend. In the traditional pattern, the head is the highest peak, while in the inverse pattern, the head is the lowest trough.
How reliable is the inverse head and shoulders pattern in trading?
The inverse head and shoulders pattern is considered one of the most reliable patterns in technical analysis, particularly for identifying trend reversals. However, like all chart patterns, its success rate is not guaranteed. The reliability of the pattern can be enhanced by confirming the breakout above the neckline with increased trading volume. Traders should also consider other technical indicators and market conditions to validate the pattern before making trading decisions.
Can the inverse head and shoulders pattern fail?
Yes, the inverse head and shoulders pattern can fail, particularly if the breakout above the neckline is weak or occurs on low volume. This can lead to a false signal, where the expected bullish reversal does not materialize, and the price continues to decline. To mitigate the risk of pattern failure, traders often wait for confirmation through additional indicators or set stop-loss orders to manage potential losses.
What timeframes are best for trading the inverse head and shoulders pattern?
The inverse head and shoulders pattern can be used across various timeframes, from short-term intraday charts to long-term weekly or monthly charts. The choice of timeframe depends on the trader’s strategy and objectives. Short-term traders may look for the pattern on hourly or daily charts, while long-term investors might find it on weekly or monthly charts. Generally, the pattern is more significant on higher timeframes, as it reflects a more substantial and potentially longer-lasting trend reversal.
How can traders maximize the effectiveness of the inverse head and shoulders pattern?
To maximize the effectiveness of the inverse head and shoulders pattern, traders should:
- Confirm the Breakout: Ensure that the price breaks above the neckline with strong volume. This increases the likelihood that the breakout is genuine and the trend is reversing.
- Use Other Indicators: Combine the pattern with other technical indicators, such as moving averages, RSI (Relative Strength Index), or MACD (Moving Average Convergence Divergence), to gain additional confirmation.
- Set Stop-Loss Orders: Protect against potential losses by setting stop-loss orders below the right shoulder or the head. This helps manage risk in case the pattern fails.
- Practice Patience: Wait for the pattern to fully develop and for the breakout to occur before entering the trade. Premature entries can lead to losses if the pattern does not play out as expected.
Conclusion
The inverse head and shoulders pattern is a powerful tool in the arsenal of technical traders, offering a reliable signal for bullish reversals. By understanding its structure, identifying it accurately, and using it in conjunction with other technical analysis tools, traders can enhance their ability to capitalize on market trends. However, like all trading strategies, it requires discipline, risk management, and continuous learning. As with any trading pattern, practice and experience are key to mastering the inverse head and shoulders pattern and using it effectively in your trading endeavors.
For more information regarding Finance Basic you can visit FinancewithAi Channel & Home
Share this:
- Click to share on LinkedIn (Opens in new window)
- Click to share on Reddit (Opens in new window)
- Click to share on Tumblr (Opens in new window)
- Click to share on Pinterest (Opens in new window)
- Click to share on Pocket (Opens in new window)
- Click to share on Telegram (Opens in new window)
- Click to share on Threads (Opens in new window)
- Click to share on WhatsApp (Opens in new window)
- Click to share on Mastodon (Opens in new window)
- Click to share on Nextdoor (Opens in new window)
- Click to share on Bluesky (Opens in new window)