Table of Contents
ToggleUnderstanding the Rising Wedge Pattern: A Comprehensive Guide

In the world of financial trading and investing, technical analysis stands as one of the most utilized strategies to forecast market movements. Within this discipline, the rising wedge pattern holds a special place, recognized for its predictive power in both uptrends and downtrends. This article will dive deep into the rising wedge pattern, exploring its characteristics, significance, and how traders can leverage it for more informed decision-making.
Introduction to the Rising Wedge Pattern
The rising wedge pattern is a potent chart formation used in technical analysis. Typically, it signals a potential reversal, particularly when it forms after an uptrend. Traders and analysts often look for this pattern because of its historical tendency to precede bearish reversals. Understanding this pattern can offer insights into potential price declines and provide an opportunity for profitable trades.
What is a Rising Wedge Pattern?
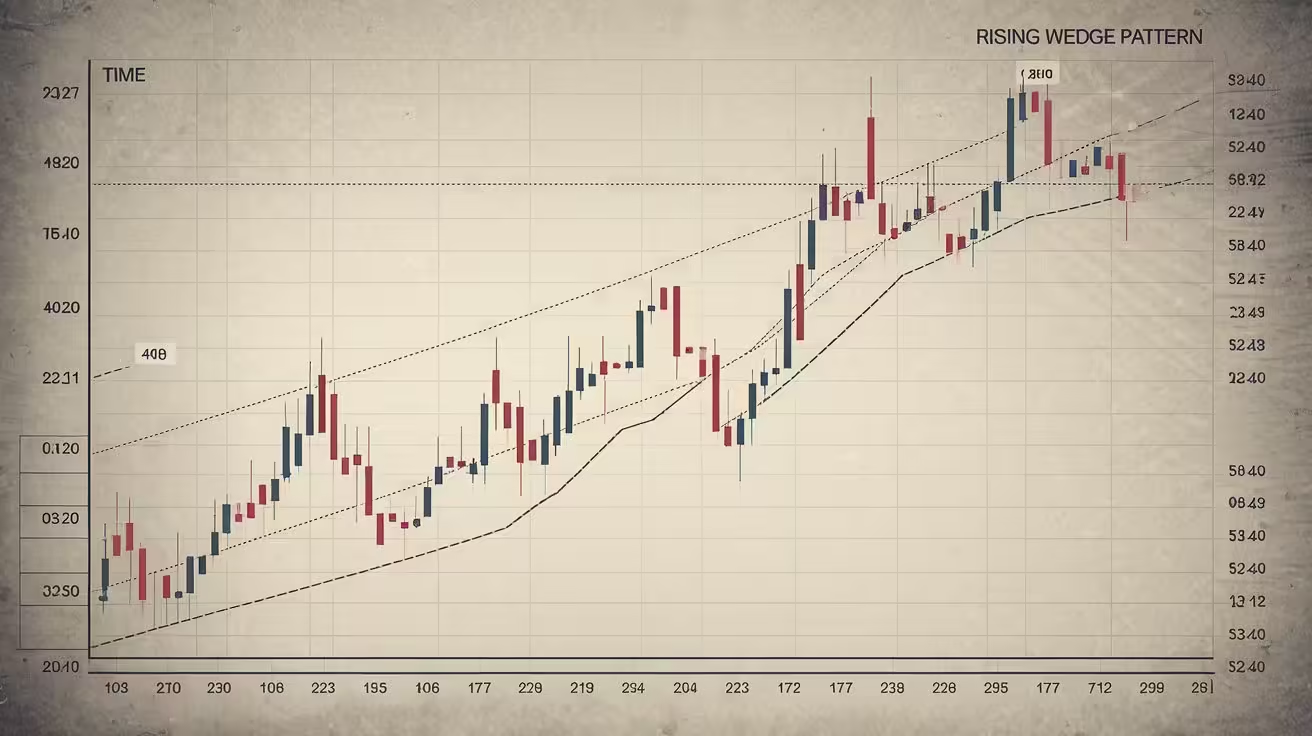
The rising wedge pattern is a chart pattern that appears when the price of an asset is trading within a narrowing upward channel. It consists of two trendlines—one connecting the higher highs and the other connecting the higher lows. These trendlines converge as the price progresses, indicating that the buying pressure is waning, and a potential reversal might be on the horizon.
A rising wedge can be both a continuation and a reversal pattern, depending on the prevailing trend before its formation. When it appears in an uptrend, it often signifies a bearish reversal, whereas in a downtrend, it might signal a temporary upward correction before the trend continues downward.
Characteristics of the Rising Wedge Pattern
To effectively identify the rising wedge pattern, it’s essential to recognize its distinct characteristics. These include:
1. Converging Trendlines: The most notable feature of a rising wedge is the convergence of the two trendlines. As the pattern progresses, the distance between the trendlines narrows, indicating a potential loss of momentum.
2. Higher Highs and Higher Lows: The price continues to make higher highs and higher lows, but the pace slows down, leading to the converging trendlines.
3. Declining Volume: As the pattern forms, trading volume typically decreases, suggesting that the upward momentum is losing steam. A breakout from the wedge, especially on high volume, can confirm the pattern’s validity.
4. Duration: The duration of a rising wedge can vary, but it typically forms over a period ranging from a few weeks to several months.
How to Identify a Rising Wedge Pattern
Identifying a rising wedge pattern requires careful observation of the price action over time. Traders should look for the following clues:
1. Trend Confirmation: Establish whether the pattern is forming in an uptrend or a downtrend. In an uptrend, the rising wedge is often a bearish reversal signal, while in a downtrend, it could indicate a temporary upward retracement.
2. Trendline Drawing: Accurately draw the trendlines connecting the highs and lows. Ensure that the trendlines are converging, not parallel. The pattern becomes more reliable as the lines move closer together.
3. Volume Analysis: Check the volume during the formation of the pattern. A declining volume typically accompanies the formation of a rising wedge, indicating weakening momentum.
4. Breakout Point: The pattern is confirmed when the price breaks below the lower trendline, ideally on increased volume. This breakout is often followed by a sharp decline in price.

The Psychology Behind the Rising Wedge Pattern
The psychology of the rising wedge pattern is rooted in market sentiment. As the price ascends within the wedge, buyers continue to push the price higher, but their strength diminishes over time. The narrowing of the wedge reflects this weakening momentum. Meanwhile, sellers gradually gain confidence, preparing to capitalize on the reversal once the breakout occurs.
This tug-of-war between buyers and sellers creates a precarious situation. The eventual breakdown from the wedge signals that sellers have taken control, often leading to a significant price decline. Understanding this psychological battle can help traders anticipate the pattern’s outcome more effectively.
Rising Wedge Pattern as a Reversal Signal
The rising wedge pattern is widely recognized as a bearish reversal signal, especially when it forms after a prolonged uptrend. Traders watch for this pattern to anticipate a potential shift from bullish to bearish market conditions. Here’s how the pattern functions as a reversal signal:
1. Uptrend Exhaustion: The rising wedge often forms at the end of a strong uptrend, signaling that the bullish momentum is waning. As the price struggles to maintain its upward trajectory, the risk of a reversal increases.
2. Bearish Breakout: The key moment occurs when the price breaks below the lower trendline of the wedge. This breakout is often accompanied by increased selling pressure, confirming the bearish reversal.
3. Price Target: After the breakout, traders typically set a price target by measuring the height of the wedge at its widest point and projecting this distance downward from the breakout point.
Rising Wedge Pattern in Downtrends
While the rising wedge is primarily known as a reversal pattern in uptrends, it can also appear in downtrends, serving as a continuation pattern. In this context, the rising wedge suggests that the temporary upward correction is losing steam and that the prevailing downtrend is likely to resume.
In a downtrend, the rising wedge forms as a corrective phase, where the price makes a series of higher highs and higher lows within the wedge. However, the lack of strong upward momentum is evident, and once the price breaks below the lower trendline, the downtrend typically continues with renewed vigor.
Trading the Rising Wedge Pattern
Trading the rising wedge pattern requires a strategic approach, as it can present both opportunities and risks. Here’s how traders can effectively trade this pattern:
1. Entry Point: The ideal entry point is just below the lower trendline of the wedge after a confirmed breakout. This entry allows traders to capitalize on the bearish reversal or the continuation of the downtrend.
2. Stop-Loss Placement: To manage risk, place a stop-loss order just above the upper trendline or the recent high within the wedge. This approach protects against false breakouts or unexpected price movements.
3. Profit Target: As mentioned earlier, the profit target is usually set by measuring the height of the wedge and projecting it downward from the breakout point. This target helps traders lock in profits before the market reverses or consolidates.
4. Volume Confirmation: A breakout accompanied by high volume adds credibility to the pattern and increases the likelihood of a successful trade. Conversely, a breakout on low volume might suggest a lack of conviction, prompting traders to wait for further confirmation.

Common Pitfalls When Trading the Rising Wedge Pattern
While the rising wedge pattern is a powerful tool in technical analysis, traders must be aware of potential pitfalls:
1. False Breakouts: One of the most common risks is the false breakout, where the price momentarily breaks below the trendline but quickly reverses, trapping traders in losing positions. To mitigate this risk, wait for a decisive breakout with strong volume.
2. Misidentification: The rising wedge pattern can sometimes be confused with other chart patterns, such as ascending triangles or channels. Properly identifying the pattern is crucial for making accurate trading decisions.
3. Over-Reliance on the Pattern: While the rising wedge is a reliable pattern, it should not be used in isolation. Traders should consider other technical indicators, such as moving averages, RSI, and MACD, to confirm the pattern’s validity and improve the overall accuracy of their trades.
4. Ignoring Market Context: The broader market context, including economic indicators and news events, can significantly impact the success of a rising wedge trade. Always consider these factors before entering a position based on the pattern.
Case Studies: Real-World Examples of Rising Wedge Patterns
To further illustrate the rising wedge pattern, let’s examine some real-world examples:
1. S&P 500 (2007-2008): During the 2007-2008 financial crisis, the S&P 500 formed a clear rising wedge pattern as it approached its peak. The pattern signaled the exhaustion of the uptrend, and the subsequent breakout led to a significant market decline, marking the beginning of the recession.
2. Bitcoin (2017): Bitcoin’s price formed a rising wedge pattern in late 2017 after an extended bull run. The pattern predicted the subsequent crash, where Bitcoin’s price fell sharply, correcting more than 50% from its all-time high.
3. Tesla (2020): Tesla’s stock price exhibited a rising wedge pattern in early 2020 after a steep rally. The pattern predicted a sharp pullback, which occurred as the broader market experienced a correction due to the COVID-19 pandemic.
These examples highlight the rising wedge pattern’s effectiveness in forecasting significant market reversals, providing traders with opportunities to profit from impending declines.
Advanced Techniques for Trading the Rising Wedge Pattern
For experienced traders, advanced techniques can enhance the effectiveness of trading the rising wedge pattern:
1. Combining with Fibonacci Retracements: Fibonacci retracement levels can be used to identify potential support and resistance levels within the wedge. If the breakout occurs near a key Fibonacci level, it adds confirmation to the trade.
2. Multiple Time Frame Analysis: Analyzing the rising wedge pattern across multiple time frames can provide a clearer picture of the overall market trend. For instance, a rising wedge on a daily chart might be confirmed by a similar pattern on a weekly chart.
3. Using Oscillators: Incorporating oscillators like the Relative Strength Index (RSI) or the Stochastic Oscillator can help identify overbought conditions within the rising wedge, further validating the potential for a bearish reversal.
4. Divergence Analysis: Look for divergence between the price action and momentum indicators. If the price is making higher highs within the wedge, but the RSI is making lower highs, it suggests weakening momentum and increases the likelihood of a breakdown.
FAQs
What is the difference between a rising wedge pattern and an ascending triangle?
A rising wedge pattern has converging trendlines, indicating a potential loss of momentum and a bearish reversal. In contrast, an ascending triangle has a horizontal upper trendline and an upward-sloping lower trendline, typically signaling a bullish continuation.
Can the rising wedge pattern occur in a downtrend?
Yes, in a downtrend, the rising wedge pattern can form as a continuation pattern, signaling a temporary upward correction before the downtrend resumes.
How reliable is the rising wedge pattern in predicting market reversals?
The rising wedge pattern is generally considered reliable, especially when confirmed by other technical indicators and volume analysis. However, like all patterns, it is not infallible and should be used in conjunction with other analysis tools.
What is a false breakout in the context of a rising wedge pattern?
A false breakout occurs when the price temporarily breaks below the lower trendline of the wedge but fails to follow through, quickly reversing direction. This can lead to losses if traders enter positions prematurely.
Is it possible to trade the rising wedge pattern on intraday charts?
Yes, the rising wedge pattern can be traded on intraday charts, but the pattern’s reliability may decrease on shorter time frames. It is important to confirm the pattern with other indicators and ensure sufficient volume to avoid false signals.
What other patterns can be used in conjunction with the rising wedge pattern?
Other patterns, such as head and shoulders, double tops, and triangles, can be used alongside the rising wedge pattern to confirm potential reversals or continuations. These patterns, combined with volume analysis and technical indicators, can enhance the accuracy of trade setups.
What is the difference between a wedge pattern and a triangle pattern?
Wedge patterns and triangle patterns are both important tools in technical analysis, but they have distinct characteristics. A wedge pattern is characterized by converging trendlines, either rising or falling, that indicate a potential reversal or continuation depending on the direction of the trend before the pattern. Triangle patterns, on the other hand, have one horizontal trendline (which can be at the top or bottom) and an opposing sloping trendline. Triangle patterns generally suggest a continuation of the existing trend, whereas wedge patterns often indicate a reversal.
How do you confirm a breakout from a wedge pattern?
Confirming a breakout from a wedge pattern involves watching for several key indicators. The most important sign is the price closing outside of the wedge’s boundaries, either above or below, depending on the pattern’s orientation. Traders often look for increased trading volume during the breakout as a sign of market conviction. If the volume is high, it adds credibility to the breakout. Additionally, confirmation can come from other technical indicators like moving averages, momentum oscillators, or trend strength indicators that suggest the breakout aligns with broader market conditions.
Can wedge patterns be traded on all time frames?
Yes, wedge patterns can be observed and traded on various time frames, from minute charts in day trading to monthly charts in long-term investing. However, the reliability of the pattern can vary depending on the time frame. Wedge patterns on longer time frames, such as daily or weekly charts, tend to be more reliable because they reflect more significant market movements and trends. On shorter time frames, the patterns might appear more frequently but can also result in more false breakouts or misleading signals due to market noise.
Is it necessary to use volume analysis when trading wedge patterns?
While not strictly necessary, volume analysis is highly recommended when trading wedge patterns. Volume can provide critical insights into the strength or weakness of a breakout. For example, a breakout from a wedge pattern that is accompanied by high volume is generally considered more reliable than a breakout on low volume, which might indicate a lack of market interest or follow-through. Volume analysis can also help distinguish between a genuine breakout and a potential false breakout, which is vital for successful trading.
How do you differentiate between a continuation pattern and a reversal pattern?
Differentiating between continuation and reversal patterns primarily involves understanding the direction of the trend before the pattern forms. Continuation patterns, such as triangles, flags, and pennants, typically occur during a trend and suggest that the trend will continue after the pattern completes. Reversal patterns, like head and shoulders, double tops, or certain wedge formations, indicate that the existing trend is likely to reverse direction. The key is to analyze the preceding trend and recognize the context in which the pattern appears to determine whether it signals continuation or reversal.
What role do stop-loss orders play when trading patterns?
Stop-loss orders are crucial when trading patterns as they help manage risk by limiting potential losses. When trading a pattern, a stop-loss is typically placed just outside the pattern’s boundaries to protect against false breakouts or unexpected market movements. For instance, in a wedge pattern, traders might place a stop-loss just above the upper trendline in a bearish scenario or just below the lower trendline in a bullish one. Properly placed stop-loss orders ensure that traders are only exposed to manageable risks while allowing them to stay in the trade if the pattern plays out as expected.
Conclusion
The rising wedge pattern is a versatile and powerful tool in the arsenal of any trader or analyst. Its ability to signal bearish reversals in uptrends and provide insight into market momentum makes it an invaluable asset for technical analysis. By understanding the characteristics, psychology, and strategic applications of the rising wedge pattern, traders can make more informed decisions and better navigate the complexities of financial markets.
While the rising wedge pattern is not without its challenges, including the risk of false breakouts and misidentification, the rewards for those who master it can be significant. Whether you’re a novice trader looking to expand your technical analysis skills or an experienced professional seeking to refine your strategy, the rising wedge pattern offers a reliable roadmap to identifying and profiting from market reversals.
For more information regarding Finance Basic you can visit FinancewithAi Channel & Home
Trading Chart Patterns: 7 Proven Strategies for Guaranteed Success
Head and Shoulder Pattern: 7 Powerful Strategies for Successful Trading
Inverse Head and Shoulders Pattern: 5 Proven Tips for Bullish Reversals
Share this:
- Click to share on Facebook (Opens in new window) Facebook
- Click to share on X (Opens in new window) X
- More
- Click to share on LinkedIn (Opens in new window) LinkedIn
- Click to share on Reddit (Opens in new window) Reddit
- Click to share on Tumblr (Opens in new window) Tumblr
- Click to share on Pinterest (Opens in new window) Pinterest
- Click to share on Pocket (Opens in new window) Pocket
- Click to share on Telegram (Opens in new window) Telegram
- Click to share on Threads (Opens in new window) Threads
- Click to share on WhatsApp (Opens in new window) WhatsApp
- Click to share on Mastodon (Opens in new window) Mastodon
- Click to share on Nextdoor (Opens in new window) Nextdoor
- Click to share on Bluesky (Opens in new window) Bluesky